


Gronk!
Senior Member
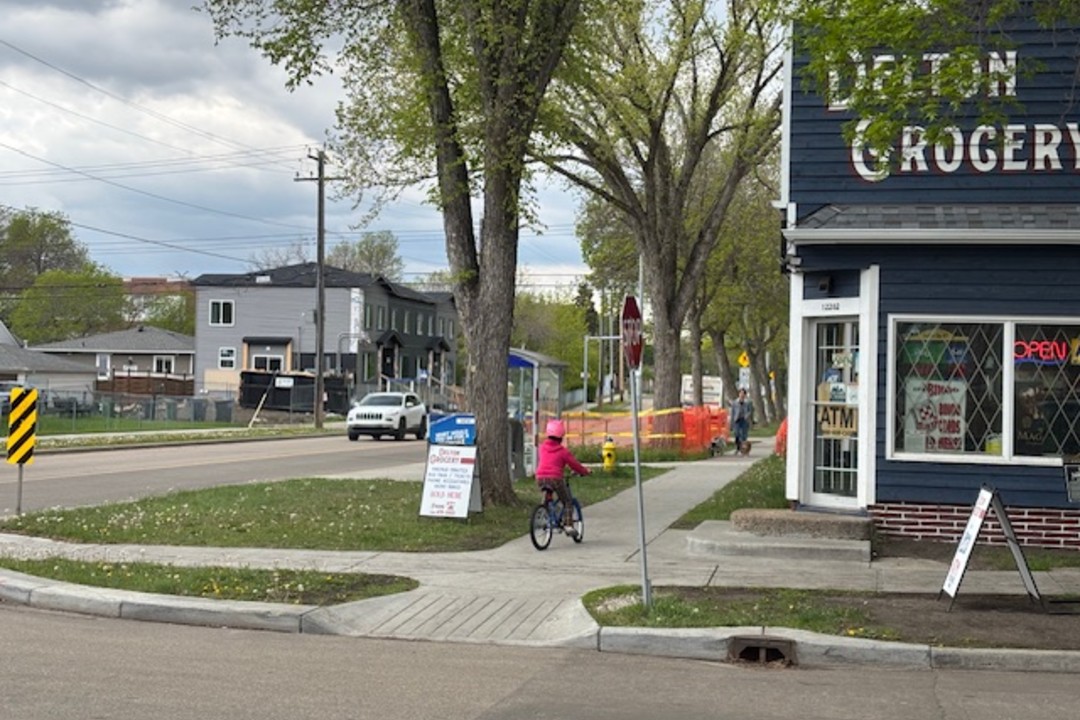
No MUP on Victoria Park Rd. I gather there'll be a permanent MUP this year but who knows when construction will commence.


|
|
|
I'd be interested to see if more detailed design plans become available eventually, because I don't really see how a standard length MUP would fit there without the lane becoming narrower?No MUP on Victoria Park Rd. I gather there'll be a permanent MUP this year but who knows when construction will commence.
I'd be interested to see if more detailed design plans become available eventually, because I don't really see how a standard length MUP would fit there without the lane becoming narrower?
The data here is a bit misleading because it calculates the entire CMA. Edmonton's CMA compared to Calgary and Winnipeg is massive. StatsCan usually collects data on a CMA basis which makes it even more difficult to grab data and conclusions from it.Not sure how accurate this is, but us being behind Wpg and Cgy is tough. Highest car use in country. https://www150.statcan.gc.ca/n1/daily-quotidien/240826/t002a-eng.htm
I find the neighbourhood profiles from the 2021 census to be decent for mode share, but even still, it's so "commuting" focused and doesn't include kids and more accurate "trip" type data. Like I would love to know how many edmontonians bike 100+ times a year, 50+, 25+, 10+, 0. Cause the fair-weather summer bikers still matter as we build infrastructure and so many people are biking beyond just the dozen or so main route counters we have. 50% of the bike trips I take never hit any of our counters.The data here is a bit misleading because it calculates the entire CMA. Edmonton's CMA compared to Calgary and Winnipeg is massive. StatsCan usually collects data on a CMA basis which makes it even more difficult to grab data and conclusions from it.
View attachment 653337
View attachment 653338
View attachment 653339
I really do wish we had municipality specific data because that would be more accurate, but unless we get a municipal census going again, we're not getting anything better for a while.
Accessible and easy to understand data is a needed tool in the fight for active transportation advocacy, so I'm in full agreement with you that we need more accurate "trip" type data.I find the neighbourhood profiles from the 2021 census to be decent for mode share, but even still, it's so "commuting" focused and doesn't include kids and more accurate "trip" type data. Like I would love to know how many edmontonians bike 100+ times a year, 50+, 25+, 10+, 0. Cause the fair-weather summer bikers still matter as we build infrastructure and so many people are biking beyond just the dozen or so main route counters we have. 50% of the bike trips I take never hit any of our counters.
Not sure how accurate this is, but us being behind Wpg and Cgy is tough. Highest car use in country. https://www150.statcan.gc.ca/n1/daily-quotidien/240826/t002a-eng.htm
Ugh, bike commuting during school pickup time is the absolute worst. People blocking corners, crosswalks, stopped randomly, pulling out randomly, U-turns wherever they want... the list goes on and on.I would be curious what the numbers are for post-secondary students at UofA, MU, NAIT and Norquest.
Even if commuting numbers are very high for driving, there is a lot of potential for other types of weekly trips to be done on modes other than the car. I really wish fewer kids were driven to school, as well.
Ugh, bike commuting during school pickup time is the absolute worst. People blocking corners, crosswalks, stopped randomly, pulling out randomly, U-turns wherever they want... the list goes on and on.